

TL;DR
Which city in my service area is the cheapest to win new customers in?
Often not the one you're based in. Opportunity is demand versus how beatable the current top three are — your home city's leaders may hold 250+ reviews while a neighboring city's are weak enough to pass in months. Our free Service Area Map ranks every SGV city for your trade on that trade-off.
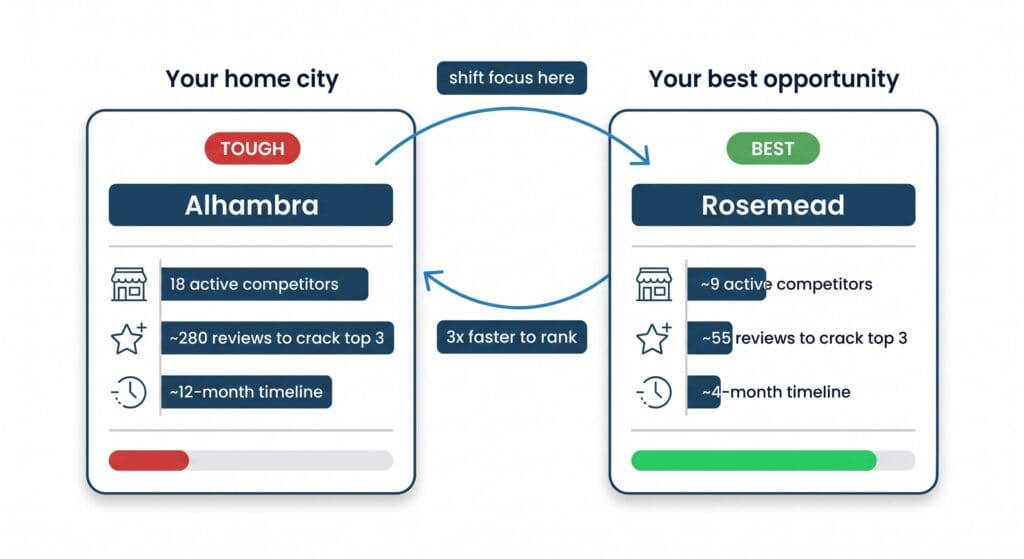
Six months ago you decided to take local SEO seriously in Alhambra. You’ve been asking every customer for a review. You’ve cleaned up your GBP. You’ve got a decent website. And you’re still #7 for “plumber Alhambra.” The top three profiles in Alhambra have 250, 280, and 310 reviews respectively. They’ve been in the market for a decade. You’re 40 reviews in. The math says you have another eighteen months of work before you crack the pack.
Meanwhile, in Rosemead — one city over, a 15-minute drive — the top three plumbers have 42, 58, and 71 reviews. There are only six established plumbers competing at all. You already serve Rosemead. You’ve done a dozen jobs there in the last six months. But your entire local SEO effort is aimed at Alhambra, so Google has no reason to rank you in Rosemead.
You’re fighting the hard fight when the easy one is right next door.
This post walks through how to figure out which city in your service area is actually your best opportunity — and why it might not be the one you’re based in.
Not all cities in your service area cost the same to win
Most home-service owners assume they should focus their local SEO on their home city. It makes sense on the surface: that’s where the shop is, that’s where the sign hangs, that’s where they know the roads.
But Google Maps doesn’t rank by shop location. It ranks by proximity + prominence. If your prominence is strong enough, you can rank in cities where you don’t have a physical presence — as long as you actually serve them, which most home-service businesses do.
Which means the strategic question isn’t “how do I rank in my home city?” It’s “which city in my real service area is the cheapest and fastest to rank in?”
Some cities are saturated: dozens of well-established competitors with 200+ reviews each. Six months of good work barely moves the needle. Other cities right next door have a fraction of the competition and top-three profiles you could match in a quarter of the time. Same customers. Same jobs. Way less work to be found.
You need a way to compare the cities in your service area side by side before you decide where to focus.
What the tool actually shows
We built the Service Area Map to run that comparison. Pick your trade and your home city. The tool scans every city in the SGV service area, pulls the actual market data for each — how many established competitors are there, how many reviews the top three have — and hands you a ranked opportunity map.
You’ll see:
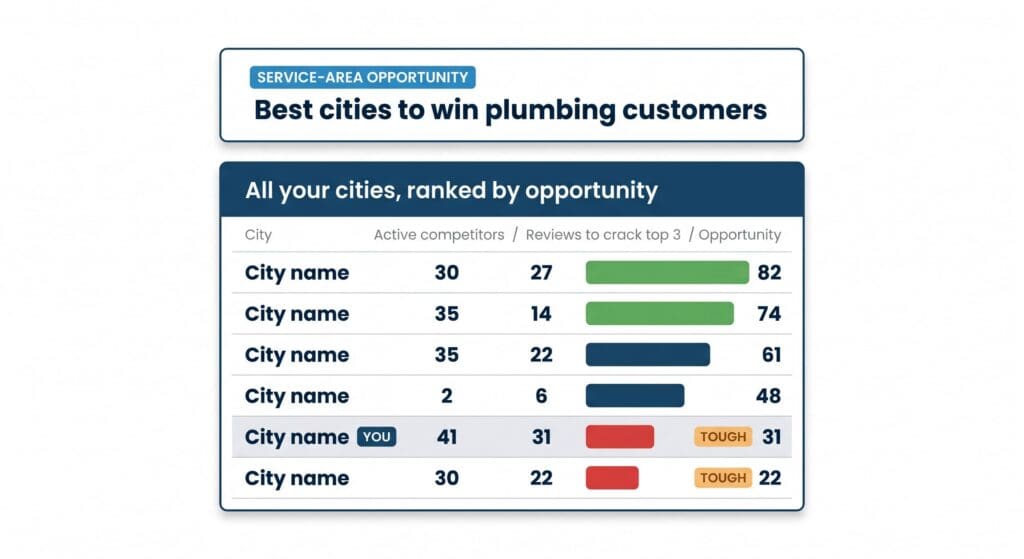
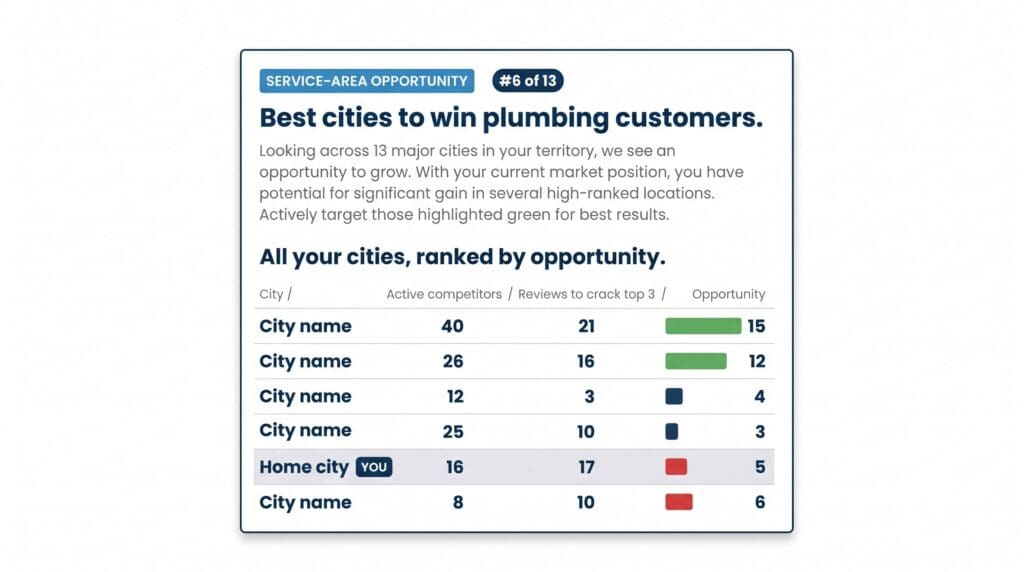
- A personal callout at the top telling you where YOUR home city ranks and what tier it’s in: “Your city, Alhambra, ranks #6 of 13 for opportunity” plus a plain-English label — wide open (go after it), workable with the right push, or tough (these others are easier targets).
- A full table with every city in your service area ranked by opportunity, showing four columns: City, Active competitors, Reviews to crack top 3, and Opportunity score (visualized as a colored bar — green for best, red for tough).
- Your city is highlighted with a “you” tag so you can spot it in the ranking at a glance.
- A fineprint explanation at the bottom: “Opportunity blends how active each market is (established competitors) with how beatable the top 3 are (their review counts). Higher = more demand you can realistically capture.”
Takes 30 seconds. Free — one name and email at the gate, then the tool runs live and the ranked map appears on the page. That’s the trade: you get the map, we get to know who to follow up with.
The two variables that determine opportunity
The tool boils each city down to two numbers, and the opportunity score is built from how they combine.
Active competitors. How many established businesses in your trade show up when someone searches from that city. More competitors sounds bad, but it’s actually a demand signal — a busy market means jobs are being booked. A city with 20 active plumbers has a bigger addressable market than a city with 3. The demand is there. That’s the numerator on opportunity.
Reviews to crack the top 3. The rough review count you’d need to match to break into the map pack. If the top three in that city have around 30 reviews each, you need about 30. If they have 300 each, you need 300. This is the “how beatable” number — the wall you’re trying to climb. That’s the denominator on opportunity.
The opportunity score puts these together: high demand + low beatability threshold = the market you can realistically win. Perfect target is a city with lots of active competitors (busy market, jobs to book) and a low review count needed (the current leaders haven’t locked it down). Those are the cities where four to six months of focused review work moves you into the pack.
How to read your tier
Three tiers cover almost every city in the SGV.
Best (green bar) — wide open, go after it. The market is active. Top three have under 50 reviews each. Realistic timeline to the pack: three to four months of focused review work. If the tool marks a city best, that’s where your next quarter’s marketing should be aimed.
Good (default bar) — workable with the right push. The market is active. Top three have 50-150 reviews each. Six-month project. Doable with a real cadence of review requests and content work, but you need to actually put in the reps.
Tough (red bar) — these others are easier targets. The market is active but the top three are locked in — 200+ reviews each, years of head start, tight owner-response habits. Timeline to crack the pack: 12+ months of consistent work. Not impossible, but you’re grinding.
Your home city’s tier tells you whether to stay put or expand focus. If your home city is Best, stay laser-focused there and don’t dilute. If your home city is Tough, use the tool to find the nearest Best or Good city and put half your effort there.
What most SGV owners don’t realize until they see the map
Three patterns show up in almost every result we’ve walked through with home-service owners in the SGV.
Your best-opportunity city is often not your home city. Roughly half the owners we run through the tool find that their home city is Good or Tough, and a Best-tier city is a couple exits down the freeway. The natural instinct is to focus on the home city because that’s where the shop is. Google doesn’t care where your shop is. It cares whether you can be at the customer’s door in a reasonable time. If you already serve the easier city, the map is telling you to make sure Google knows that.
Chasing the highest-demand city is often the wrong move. The city with the most active competitors is the busiest market — and also the most-fought-over. High demand + high review threshold = tough. The opportunity score corrects for this: it doesn’t reward “biggest market” — it rewards “biggest market you can realistically win.” That’s usually one or two cities down the list from the biggest.
The best-opportunity city usually stays the best-opportunity city for years. Markets don’t shift fast. A city that’s wide open today will still be wide open next quarter. Which means whatever the tool tells you is your Best city, that’s a two-to-three-year strategic bet, not a monthly refresh. Pick it and commit.
Related: use this alongside your rank check and grade
The Service Area Map tells you WHERE to focus. If you haven’t run our other two tools yet, they answer the natural follow-ups:
- The Local Rank Checker tells you WHERE you currently rank in that city — so once the map tells you which city to target, the rank checker tells you how far you have to go.
- The Map Pack Grader tells you WHY you’re not in the top 3 in a city — so you can see exactly which GBP signals are behind or on par vs the leaders in your chosen target.
Running all three takes about two minutes and gives you a complete strategic picture: which city to prioritize, what your current standing is there, and what specific work will move you.
Check yours in 30 seconds
Enter your trade and home city into the Service Area Map. You’ll get the same ranked opportunity map we look at when we plan expansion for a new client. Free — name and email at the gate, then the tool runs live and the map appears on the page. No upsell inside the tool.
Two things to look for the moment your result loads:
- Your home city’s rank and tier — that’s the reality check on whether your current focus is right
- The top 2-3 Best-tier cities — those are your real strategic options for the next quarter of local SEO work
How City Boost helps
We do Local SEO for home-service businesses across the SGV — the market selection, the GBP configuration, the review-generation cadence, and the citation work that turn the “best opportunity” cities on this map into your actual booked-jobs pipeline. If your map shows a Tough home city and a Best city one over, that’s the exact scenario we help owners navigate every quarter — deciding how much to shift focus, how fast, and what specific work to do first in each.